XAUUSD Risk Zones Analysis – High, Medium & Low Risk Levels (Feb 2026)
Gold (XAUUSD) 60-minute technical analysis identifying key High Risk, Medium Risk, and Low Risk zones. This short-term risk map helps traders manage volatility, liquidity sweeps, and optimal positioning in February 2026.
GOLD ANALYSIS
2/15/20262 min read
XAUUSD Short-Term Risk Structure Analysis – February 2026 Outlook
Market Overview
Gold (XAUUSD) is currently trading within a structured short-term volatility framework on the 60-minute timeframe. Recent price behavior suggests rotational movement between defined liquidity zones rather than impulsive directional expansion.
Understanding where price sits inside these zones is critical for risk management, position sizing, and capital preservation.
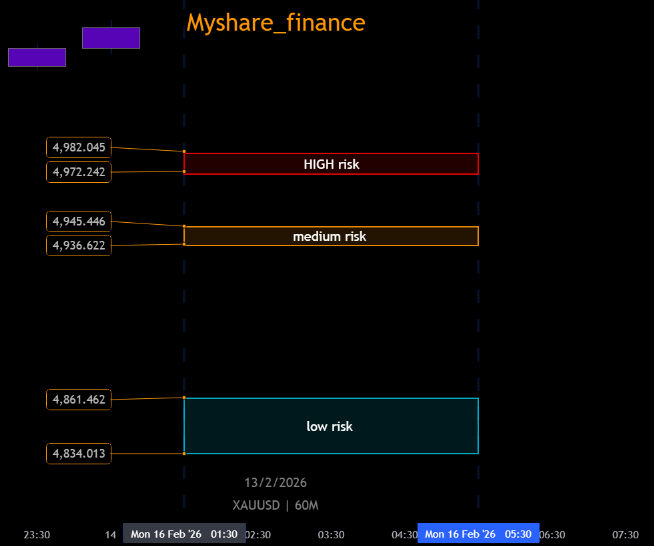
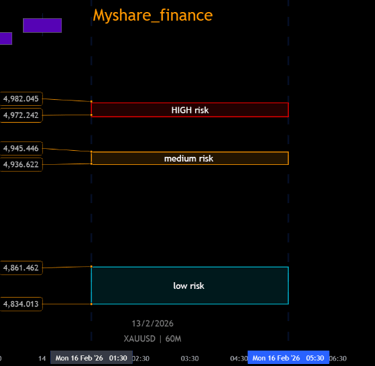
This report outlines three clearly defined technical regions: High Risk, Medium Risk, and Low Risk zones.
⸻
High Risk Zone: 4,972 – 4,982
The upper resistance band represents a statistically elevated volatility area.
Price entering this zone typically signals:
• Liquidity sweep probability
• Stop-hunt behavior
• Aggressive rejection risk
• False breakout potential
From a structural perspective, this level aligns with prior reaction highs and short-term exhaustion zones.
Positioning inside this area without confirmation increases exposure to sharp intraday reversals. Traders should prioritize protection over aggression when price trades near this band.
⸻
Medium Risk Zone: 4,936 – 4,945
This region functions as a transitional equilibrium zone.
Characteristics include:
• Balanced order flow
• Short-term consolidation memory
• Institutional repositioning behavior
This level may act as either:
• Pullback continuation support
• Temporary distribution range
• Intraday decision area
Risk in this zone is moderate, meaning confirmation signals and volume behavior should guide exposure decisions.
⸻
Low Risk Zone: 4,834 – 4,861
The lower demand structure presents a comparatively stronger risk-reward profile.
This area historically reflects:
• Accumulation behavior
• Defensive liquidity absorption
• Reduced downside extension probability (short term)
From a strategic standpoint, this zone favors structured entries with defined invalidation levels.
Lower risk does not mean guaranteed upside — it indicates improved positioning efficiency relative to volatility exposure.
⸻
Structural Interpretation
The current XAUUSD structure suggests range compression between supply and demand layers.
As long as price remains between 4,834 and 4,982, market behavior is rotational rather than trending. A decisive break outside these boundaries would signal volatility expansion and potential directional continuation.
Traders should focus less on predicting direction and more on identifying where risk is elevated versus where it is statistically optimized.
⸻
Risk Management Perspective
Professional trading is not about forecasting exact price targets. It is about understanding:
• Where liquidity clusters exist
• Where volatility increases
• Where capital exposure becomes asymmetric
High-risk areas demand caution.
Low-risk areas allow structured positioning.
Medium zones require confirmation.
Location matters more than prediction.
⸻
Conclusion
Gold remains structurally balanced on the short-term timeframe. Until a breakout occurs, reaction-based strategies are statistically more efficient than breakout chasing.
Monitoring how price behaves inside each risk layer will provide clearer insight into whether gold is preparing for expansion or continued rotation.
MyShare Finance will continue monitoring XAUUSD for structural shifts and volatility expansion triggers.