result of Gold (XAUUSD) Price Zones
This post presents a short-term technical overview of Gold (XAUUSD) based on price behavior and key liquidity zones. The highlighted buy and sell areas are shown for educational purposes only and reflect market structure at the time of analysis. This content does not constitute financial advice.
MARKET ANALYSIS & SIGNAL RESULTS
12/17/20251 min read
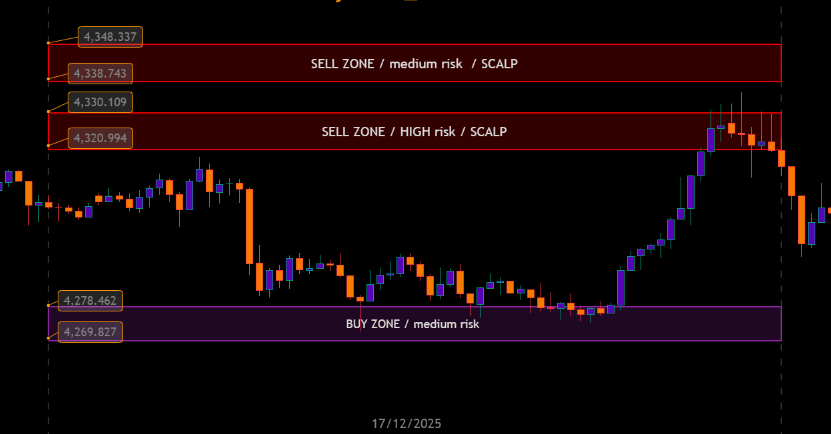
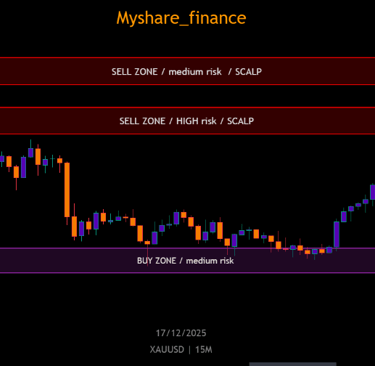
This chart illustrates key buy and sell zones for Gold (XAUUSD) based on recent price action.
The lower highlighted area represents a potential demand zone where buying pressure previously appeared.
The upper zones mark areas of potential supply, where selling pressure may increase in the short term.
These zones are used by traders to better understand market structure, risk levels, and possible reactions — not as guaranteed outcomes.