Gold (XAUUSD) Volatility Map | Risk Zones Explained
This analysis highlights high-risk and very high-risk zones on the XAUUSD 15-minute chart, helping traders understand where volatility increases and price behavior becomes less predictable. The focus is on structure, risk awareness, and market conditions rather than directional bias.
MARKET ANALYSIS & SIGNAL RESULTS
12/25/20251 min read
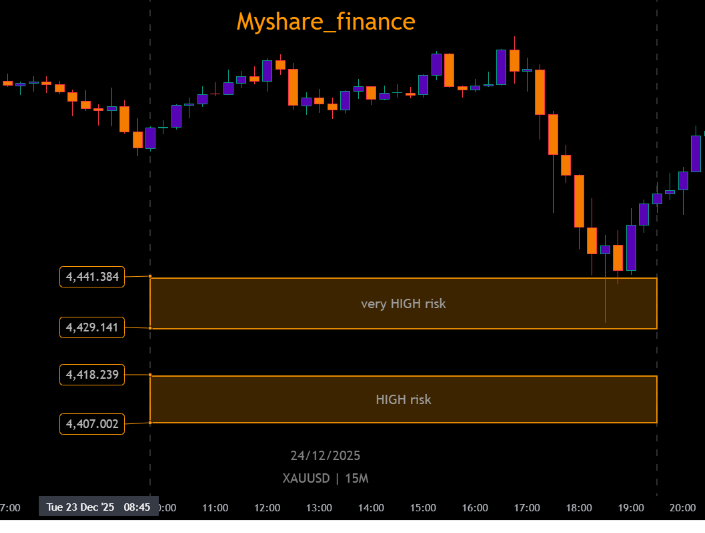
This XAUUSD 15-minute chart illustrates how gold behaves when price enters high-risk and very high-risk zones, where volatility expands and emotional trading often increases.
Such zones usually appear during liquidity shifts and rapid repricing, making patience and risk management more important than aggressive decision-making. Instead of focusing on short-term direction, this analysis emphasizes market structure, risk awareness, and disciplined execution.