Gold (XAUUSD) Risk Zones Analysis – 15 Minute Chart
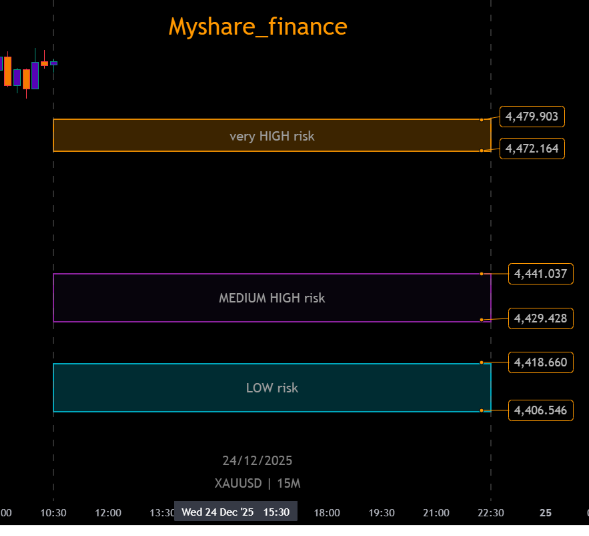
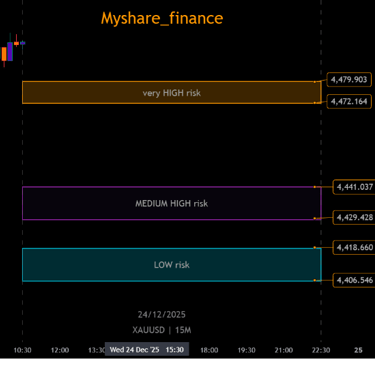
This chart highlights three clearly defined risk zones for Gold (XAUUSD) based on short-term market structure and volatility on the 15-minute timeframe. Instead of predicting direction, this framework focuses on risk management and position awareness.
GOLD ANALYSIS
12/24/20251 min read
This chart highlights three clearly defined risk zones for Gold (XAUUSD) based on short-term market structure and volatility on the 15-minute timeframe. Instead of predicting direction, this framework focuses on risk management and position awareness
🔴 Very High Risk Zone
4,472 – 4,480
Price movement in this zone is extremely sensitive. Volatility is elevated, fake breakouts are common, and risk-to-reward becomes unfavorable. Entries here require advanced execution and strict stop control. For most participants, exposure in this range carries a high probability of emotional and execution errors.
🟣 Medium-High Risk Zone
4,429 – 4,441
This is a transitional zone where price often reacts sharply to liquidity and short-term news. Trades can work here, but only with clear confirmation and reduced position size. Risk remains significant, especially during low-liquidity sessions.
🟢 Low Risk Zone
4,406 – 4,418
This area represents the most balanced zone from a risk perspective. Market behavior is generally more structured, allowing for better decision-making and cleaner trade management. From a strategic standpoint, this zone offers the most controlled environment for participation.
This analysis is not about forecasting exact price direction. It is about understanding where risk is concentrated and adjusting behavior accordingly. In volatile markets like gold, long-term survival depends more on where you trade than how often you trade.
Risk management always comes before profit.