Gold (XAUUSD) 15-Minute Analysis: High-Risk Resistance Zones Explained
A short-term technical analysis of Gold (XAUUSD) on the 15-minute timeframe, highlighting high-risk and very high-risk resistance zones. This breakdown explains where price reactions may occur and why disciplined risk management is essential near key liquidity levels.
GOLD ANALYSIS
12/23/20251 min read
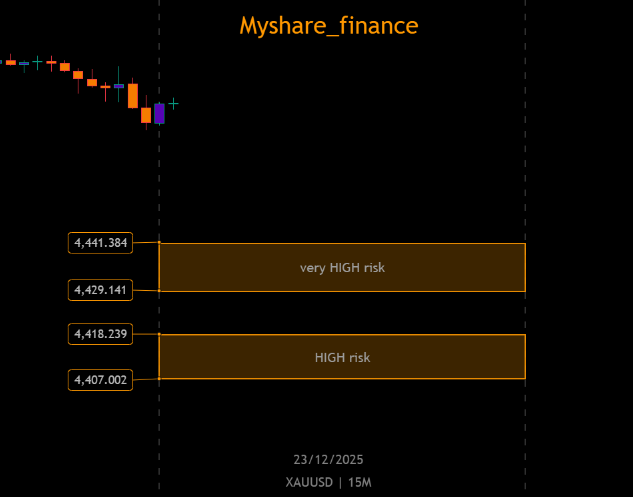
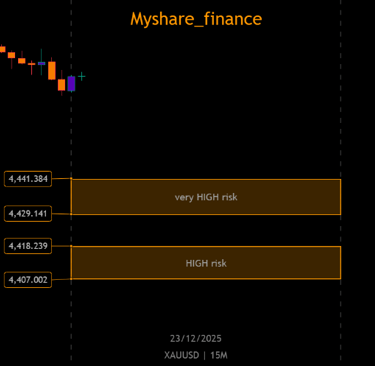
The chart above shows the current short-term structure of Gold (XAUUSD) on the 15-minute timeframe, highlighting key resistance zones where price reaction risk is elevated.
At the current stage, gold is trading below recent highs, and the marked zones represent areas where selling pressure may increase due to liquidity concentration and previous price reactions.
🔴 Very High-Risk Zone
4,429 – 4,441
This upper zone represents a major short-term resistance area. If price moves into this range, the probability of sharp volatility and rejection increases significantly.
Entries near this level carry very high risk, especially without confirmation from volume or momentum indicators.
🟠 High-Risk Zone
4,407 – 4,418
This lower zone acts as an intermediate resistance, where price may pause, react, or attempt a minor pullback.
While less aggressive than the upper range, this area still requires strict risk management and patience.
Market Insight
In short timeframes, gold often reacts strongly around predefined liquidity zones. Chasing price inside these highlighted areas can expose traders to sudden reversals and fake breakouts.
The primary focus at this stage should be:
• Capital protection
• Waiting for clear confirmation
• Avoiding emotional entries near resistance
Final Note
This analysis is based on price behavior and structure, not prediction.
Risk levels change dynamically, and disciplined execution remains more important than direction.